I am not able to fully explain the amazingly complex science behind the electronics in side this scanner device but I can have a go at explaining the principle.
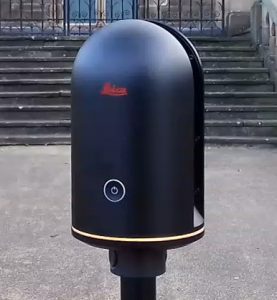
These two looping little videos show how the LiDAR device (Light Detection and Ranging) the college has (a Leica BLK360) functions – the laser beam has been ultra-exaggerated – in reality it’s virtually invisible – and it is harmless.

… and from a bit further away:

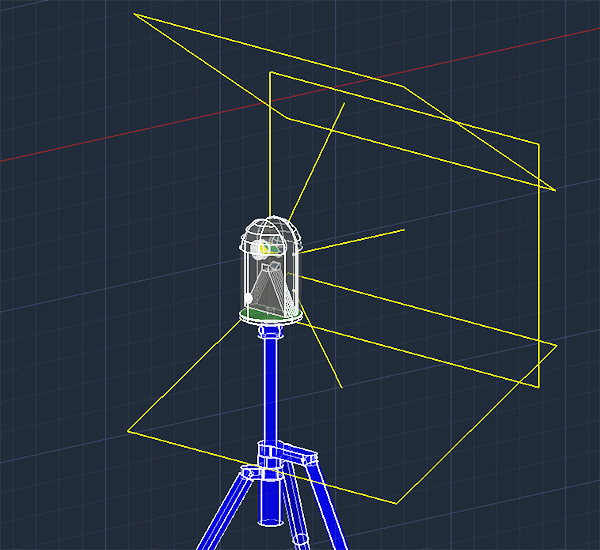
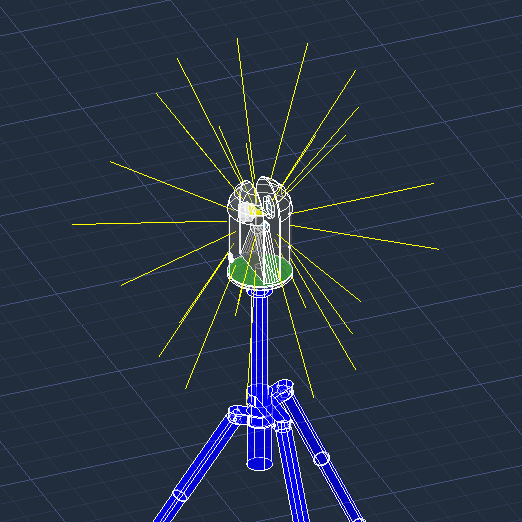
The laser is beamed at a 45 degree mirror which is rotating, this fires out the beam at 90 degrees in an arc. The arc can only manage 300 degrees as the unit itself gets in the way.
The beam of light is spinning in the vertical plane as you can see above but it is also rotating in the horizontal plane thus generating a spherical projection of beams. The photographic pass is a full 360 degrees but the scanning pass is 180 degrees since the beam can fire out in two directions. The graphic below tries to indicate this:
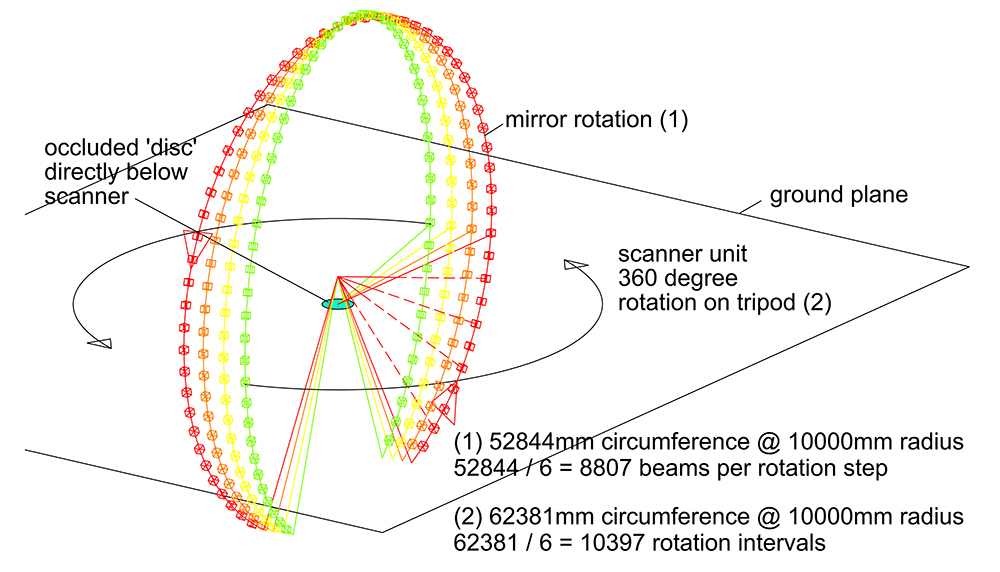
If you multiply the numbers of ‘vertical’ scans (1) by the number of horizontal rotation steps (2) then you get a massive 91 million points – this is probably considerably more than are actually recorded in a scan. I have taken the Leica specification ‘accuracy level’ of 6mm accuracy at 10m in to my calculation here.
A laser beam will do one of two things … it will hit something or it won’t. The latter beams are lost and do not reflect back. Those beams that hit something return to the device, hit the 45 degree mirror and re-enter the unit to be ‘collected’ and ‘scrutinised’ by sensors.
The sensors measure: the time a laser beam takes to return (time of flight), this basically gives us the 3D scene – a record of collisions with objects. The sensor does not know what the objects are of course … one day they might! In some scanners the wavelength that returns can be measured and this determines the colour of the object that the beam hit. The strength of the return beams gives us the ‘intensity’ measurements – something light shaded will reflect more light and therefore appear more ‘intense’.
The direction an object is facing can be determined from the intensity of the return beams (approximately) – this is called the ‘normal direction’.
This all happens at light speed – it really is mind blowing science and the accuracy of the electronic engineering is staggering. You have to just put that to one side and get on with enjoying the device and marvel at how useful it is for capturing accurate site information very quickly.
The result is called a ‘point cloud’ – this is actually a misnomer. A cloud implies there is ‘material (i.e. points) all the way through it. A laser ‘point cloud’ is really a layer of points that define the surface shape of an object or objects since the laser cannot penetrate stone or steel and identify ‘points’ inside it. When it hits glass it usually passes inside and we get a reading of the shapes inside the space, When it hits water it reflects away from us and is absorbed so you get no reading from water.
Show me a scan please?
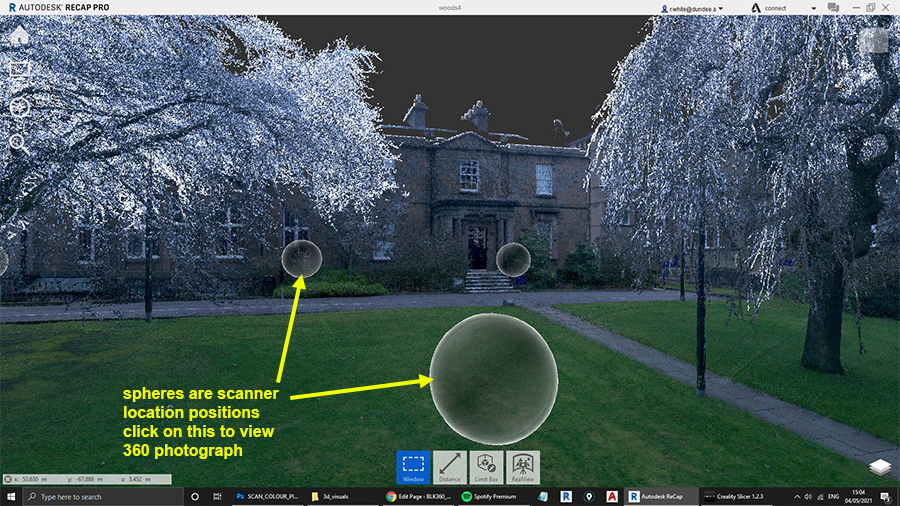
Here’s a screen grab from AutoDesk Recap Pro of a scan I made during lockdown (February 2021) on my campus here at Dundee.
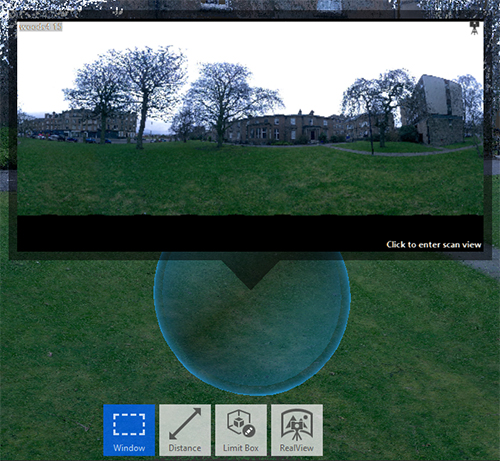
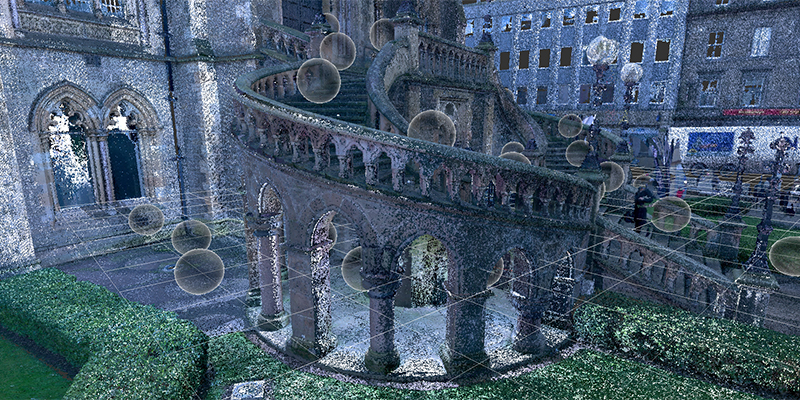
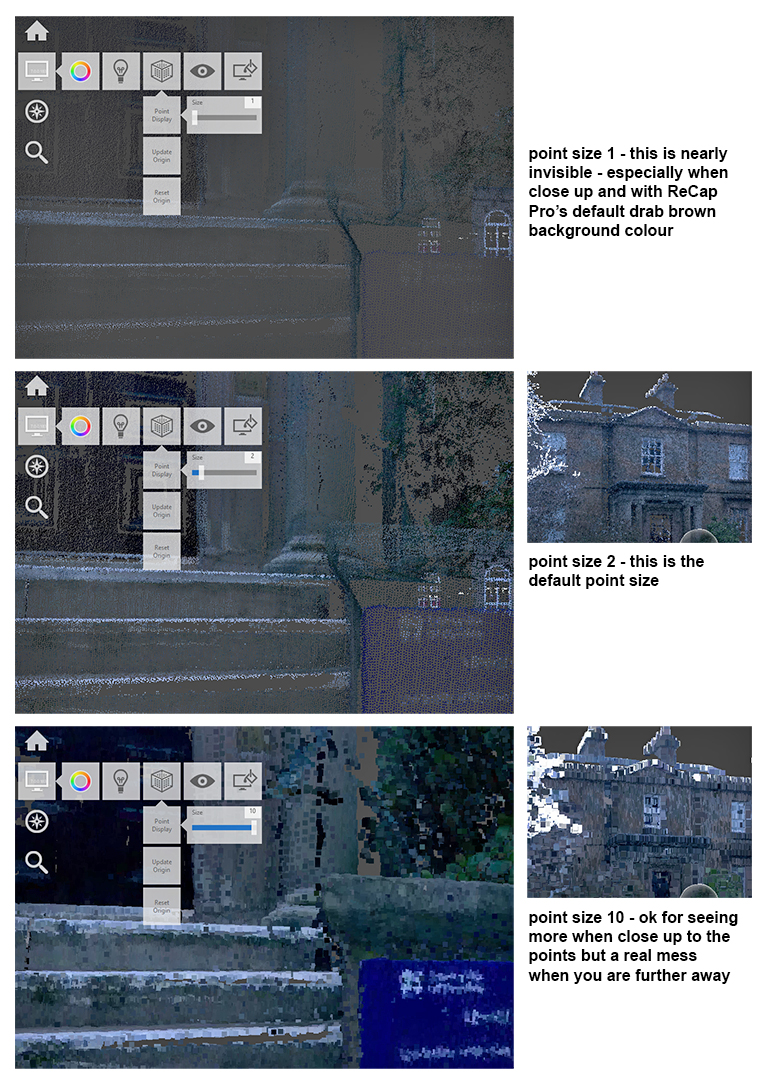
Let’s ‘zoom in’ closer to near those white stripy steps – there’s a blue sign on the stone bracket. The points in the scan are a constant size (size 2 by default) so if we get too close then we start to see the space between the points and the objects become less discernible.
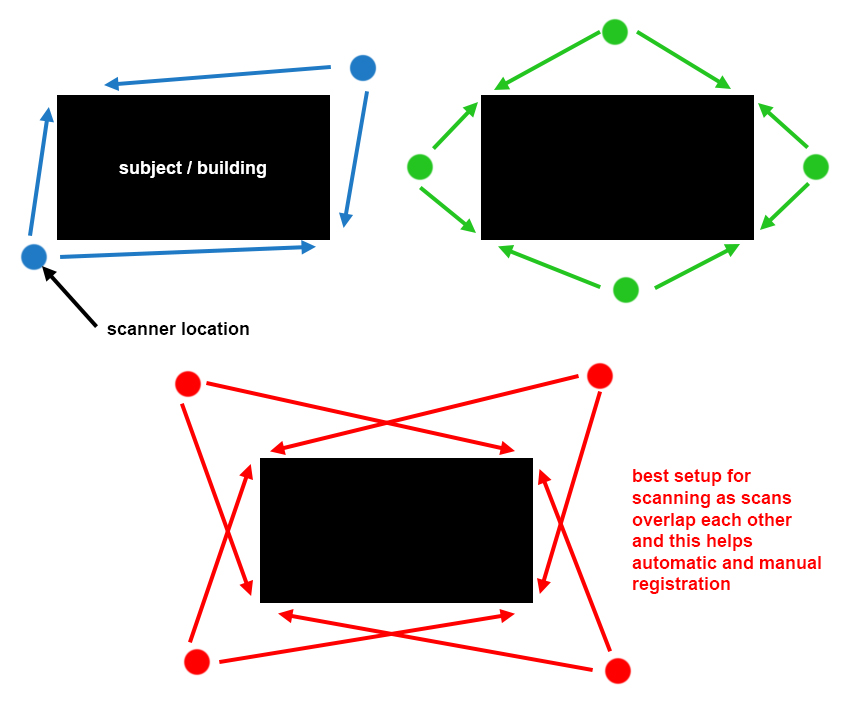
As you saw in the first view there were multiple scan locations (sphere positions) – we need to join our scans together to cover more area or bigger objects as the laser only has so much range (approx 50m of useable data).
Imagine you are trying to scan a house sitting on it’s own in a field – you would need a minimum of two scans but this would likely lose a bit too much detail in doorways and window openings so 4 is a more likely number of scans. Joining these scans together is the clever and tricky part of scanning so as you can see below if you make sure your scans overlap to some degree then it really helps.
Joining Scans Together – ‘Registering’
You can’t collect all the information for a site in one single scan, the scanner unit is moved to get a better view and reduce the amount of the scene that is ‘occluded’ (hidden/obscured).
The more projections in all 3 directions (x, y and z) the better the ‘balance’ is for your registration and the more accurate your overall project will be.
Below is a good description of how registration works – this text is by Marc Zinck – a Contributor to the Recap Pro Forum.
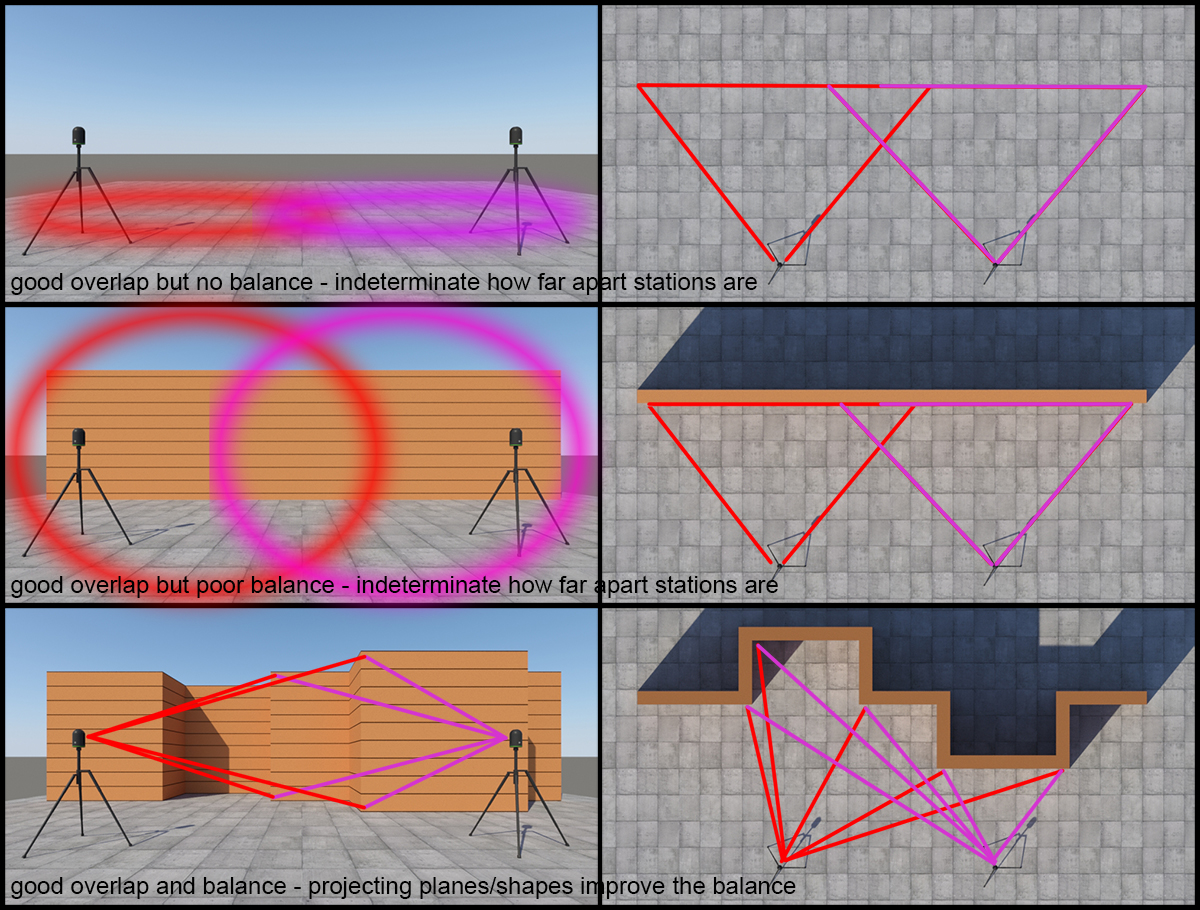
The effect of Balance on the registration
Ensuring sufficient balance in registration is critical to achieving high quality registration results. Balance is a metric which encodes the relative contribution of the data in three orthonormal directions, that is to say, it indicates how ‘constrained’ the registration is in different directions.
Imagine that you have two scans from the middle of an empty lot. The dominant feature is the ground, and all points exist in a single plane. This configuration constrains the registration strongly in the vertical direction, however, since there is a lack of additional features, it is not possible to accurately lock down the relative horizontal position of the two scans.
Now imagine a long flat brick wall in the middle of this otherwise empty lot. That wall will constrain the registration in a second dimension, specifically the direction normal to the wall, however the registration is still not fully constrained since it is still not possible to accurately determine where along the wall to place the scans. It may help to think of the scans being able to “slide” along one another.
Finally, imagine a second wall, perpendicular to the first wall. At this point there are strong features in three perpendicular, or orthonormal, directions. Scans which contain all three features (the ground and the two walls), should register together with good values for balance.
Real world environments where this issue can arise include long and straight featureless corridors.
I encourage you to pay attention to the balance metric, it may be able to help guide your scan station placement such that they contain enough features in different directions to achieve high quality registration results.
Another succinct description of how Recap Pro determines how accuracy your scan registration is:
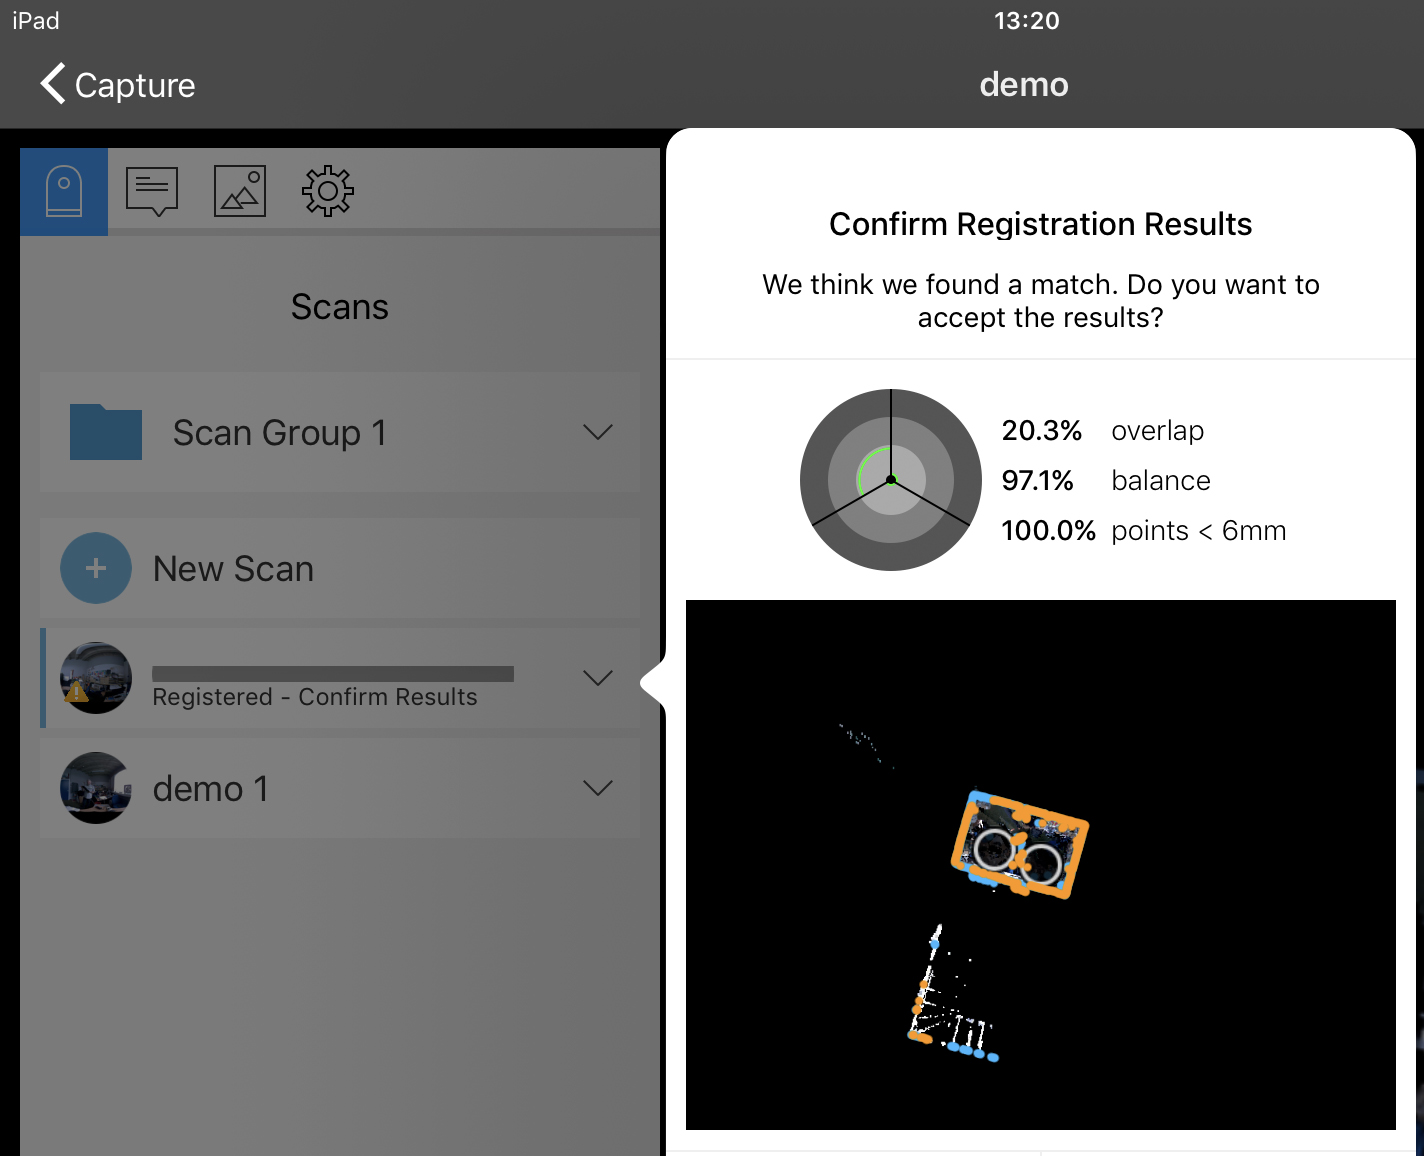
Overlap represents the amount of scan data that can be used for registration. ReCap Pro recommends at least 30% of overlap between each scan in order to process the registration properly.
Balance represents the quality of the features (or surfaces) used for registration. Features with surfaces that face in all x, y and z directions will produce better results than surfaces that face in one or two directions.
The points less than 6 millimeters inquiry section tracks how many points in the unregistered scan are within 6mm of the registered data. Data in this range indicate a consistent match between scans.
Modelling from scans – http://constructible.trimble.com/mep-industry/how-to-create-a-3d-cad-model-from-a-laser-scanned-point-cloud-overview.
Colour of Scan Points
We saw above that the grass was green and the sign on the building a strong blue … how does the BLK360 scanner record colour?
It is in fact quite crude – but also a technical miracle!
The BLK360 has 3 cameras on it’s ‘backside’ – one facing up at an angle, one facing horizontally and one facing down at an angle.
Before the BLK360 does the laser scanning it does a photographic sweep first – collecting 27 images – 9 sets of 3 photos which get stitched together by the AutoDesk Recap App on the iPad that is used with the scanner.
Here’s what a photograph looks like once it has been stitched – right-click it and view it in a separate window to see it full size (8000×4000 pixels) – just clicking on it might not enlarge it.
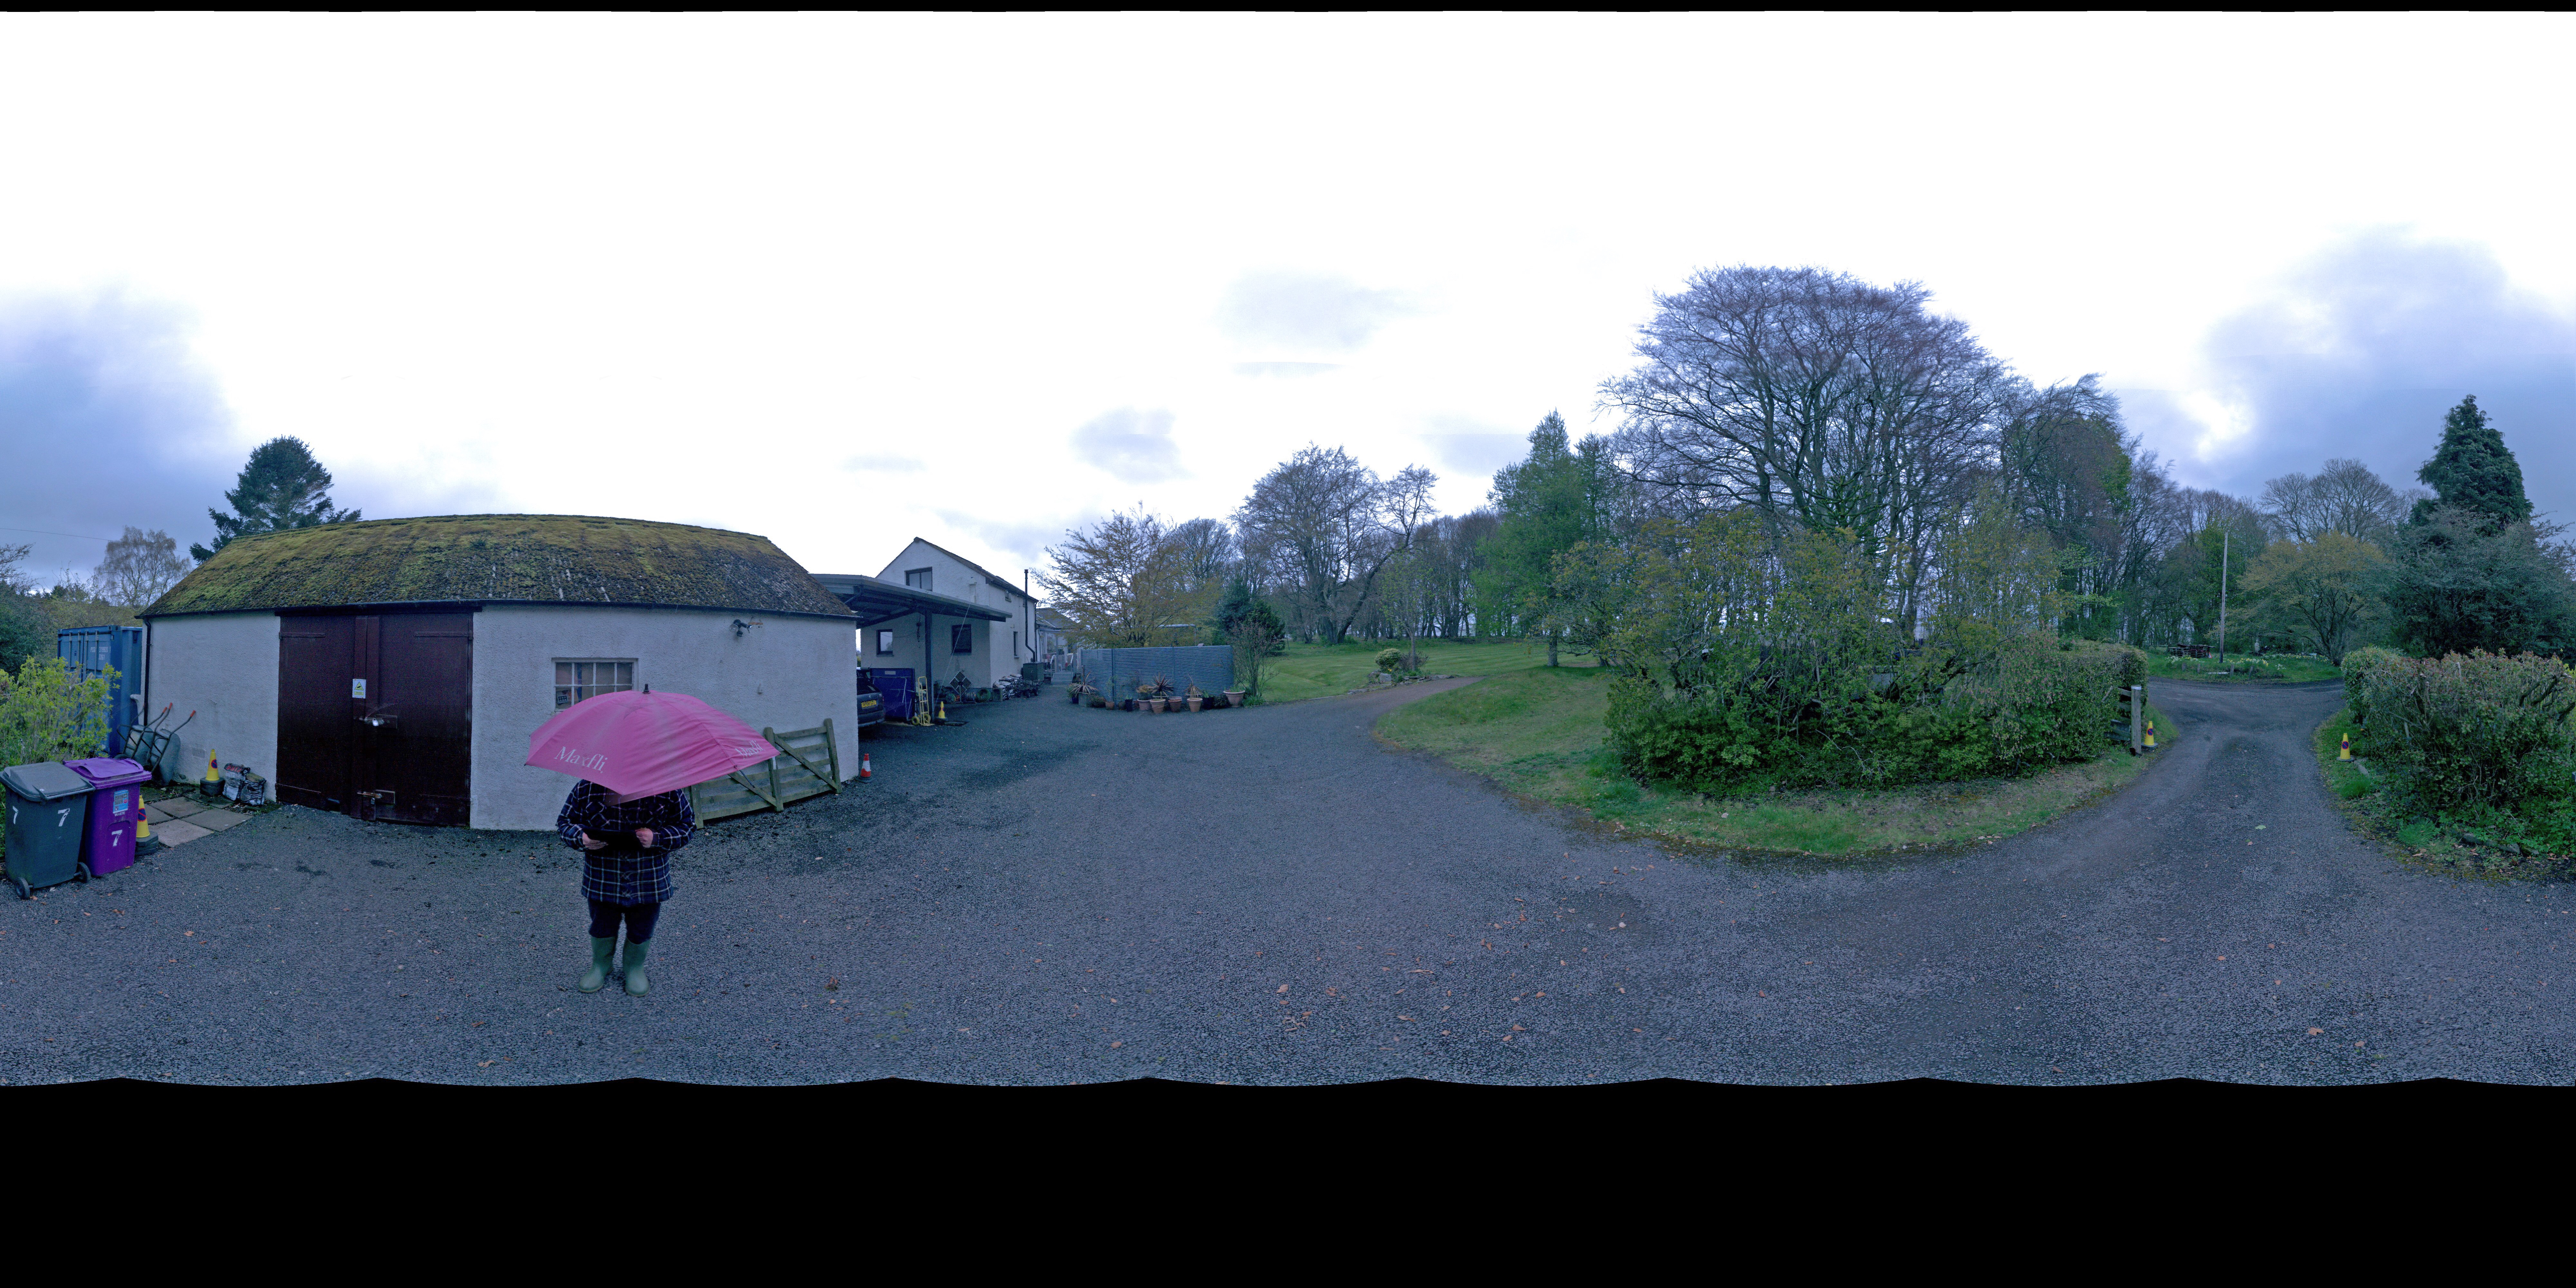
There’s an area below the scanner that cannot be photographed or scanned hence the black strip at the bottom of the photo.
The photograph is important as this carries the colour information that is assigned to the ‘points’ that the laser finds – the point basically takes on the colour of the pixel through which it passes in the photograph.
I have intentionally stood close to the scanner as it did it’s photographic sweep holding a (broken) bright pink golfing umbrella.
Once the photos were taken I quickly moved to behind the scanner so that the laser did not hit me – not for safety reasons but to make sure the beams hit the wall and gate that were behind me during the photographic pass.
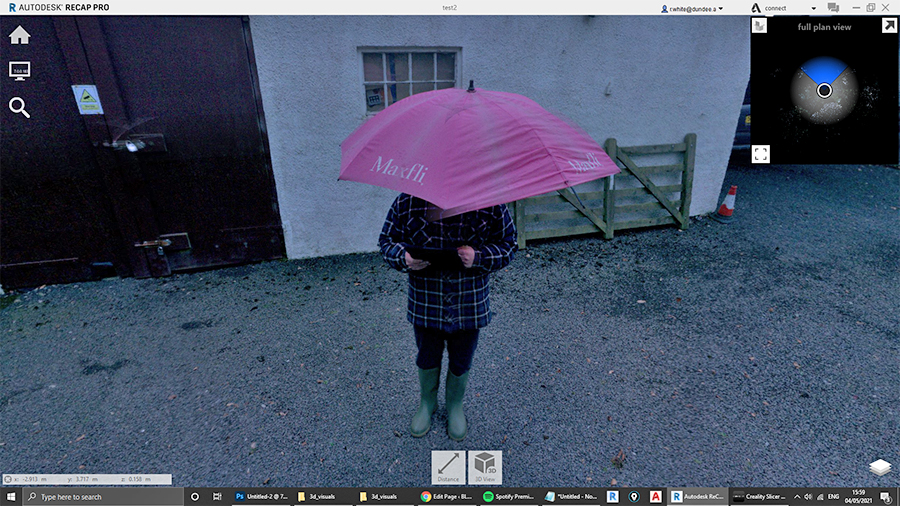
Here’s what the scanner photographed (real view)
Next we change to ‘3d view’ – notice it looks a bit grainy now:
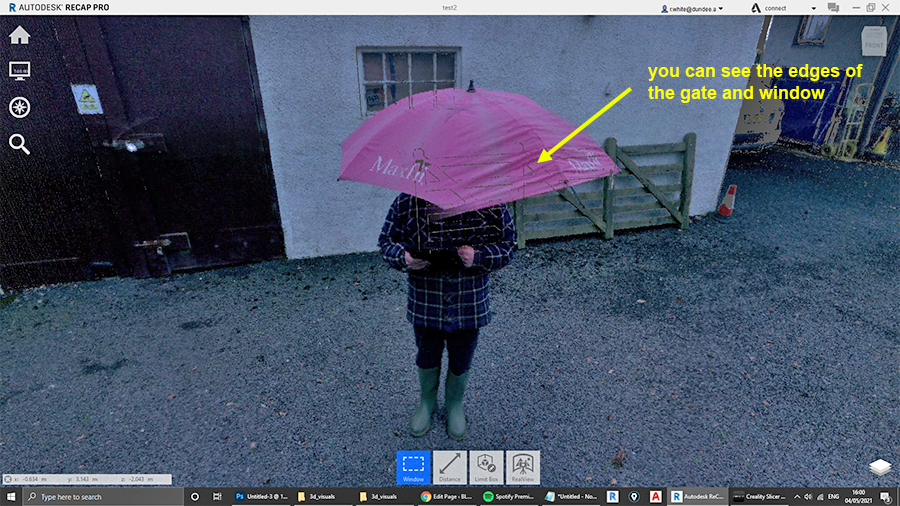
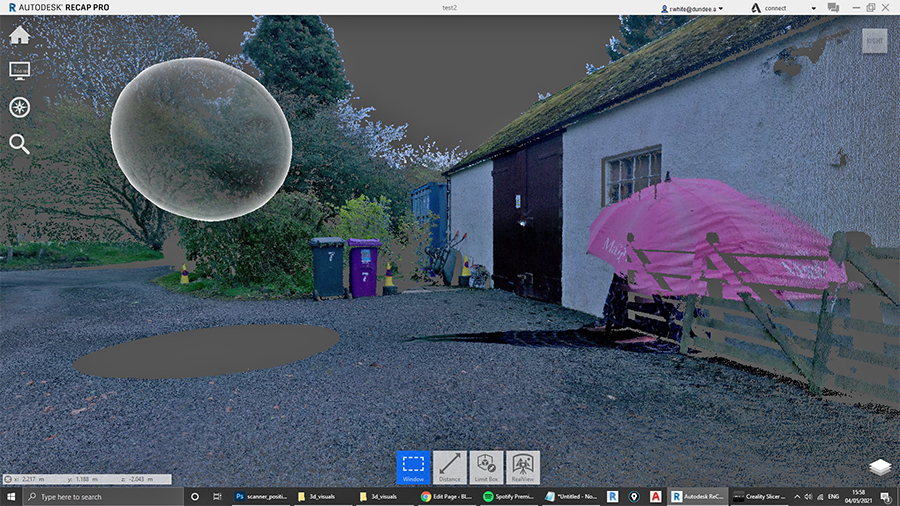
But when we move to the side you can see what is actually going on – me and my umbrella are part of the scan even though we were not stood in the laser beam – the beam hit the shed wall, window and gate and recorded their distance but the colour information came from the 360 photograph.
Here’s what the point cloud looks like if you scan it without photography:
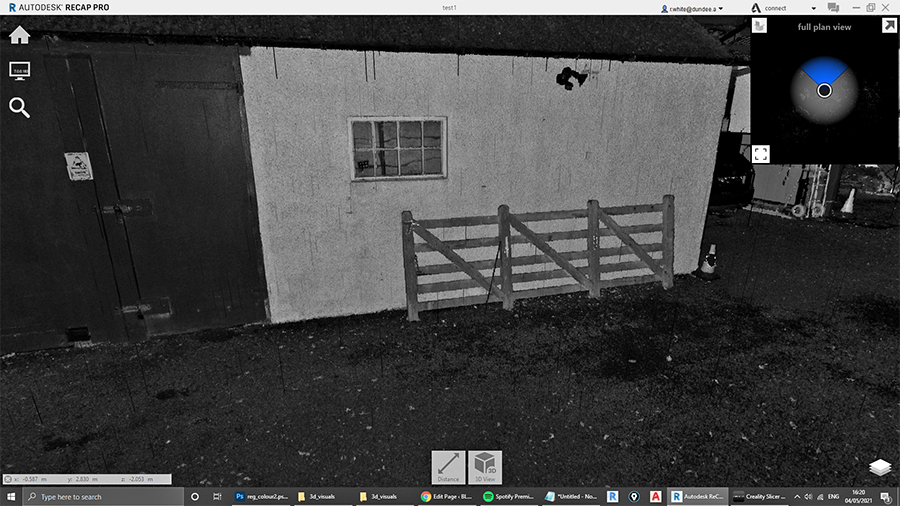
All we are getting is shapes and their monochromatic colours are from reflection intensity – the white sign on the shed door, white wall and window frames are clearly discernible but the very reflective material on the traffic cone returns dark – strange!
So to sum up … with a cool graphic
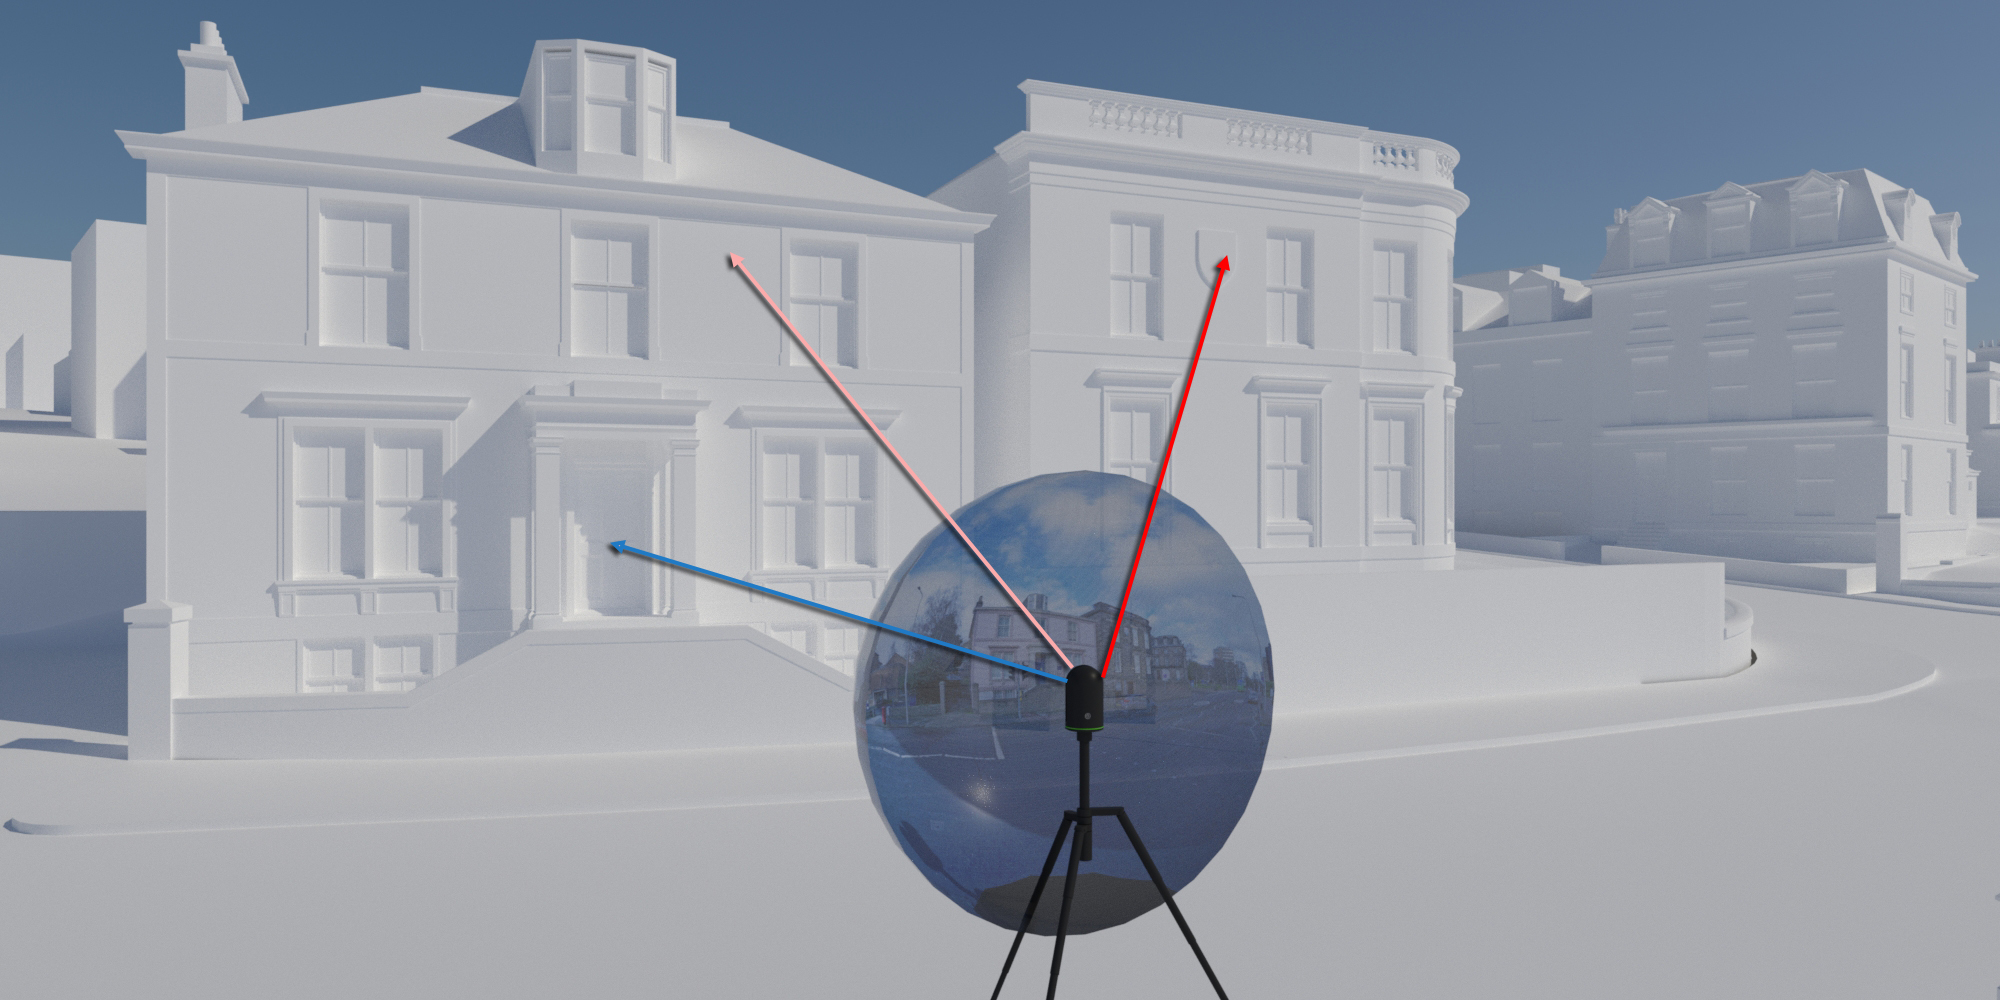

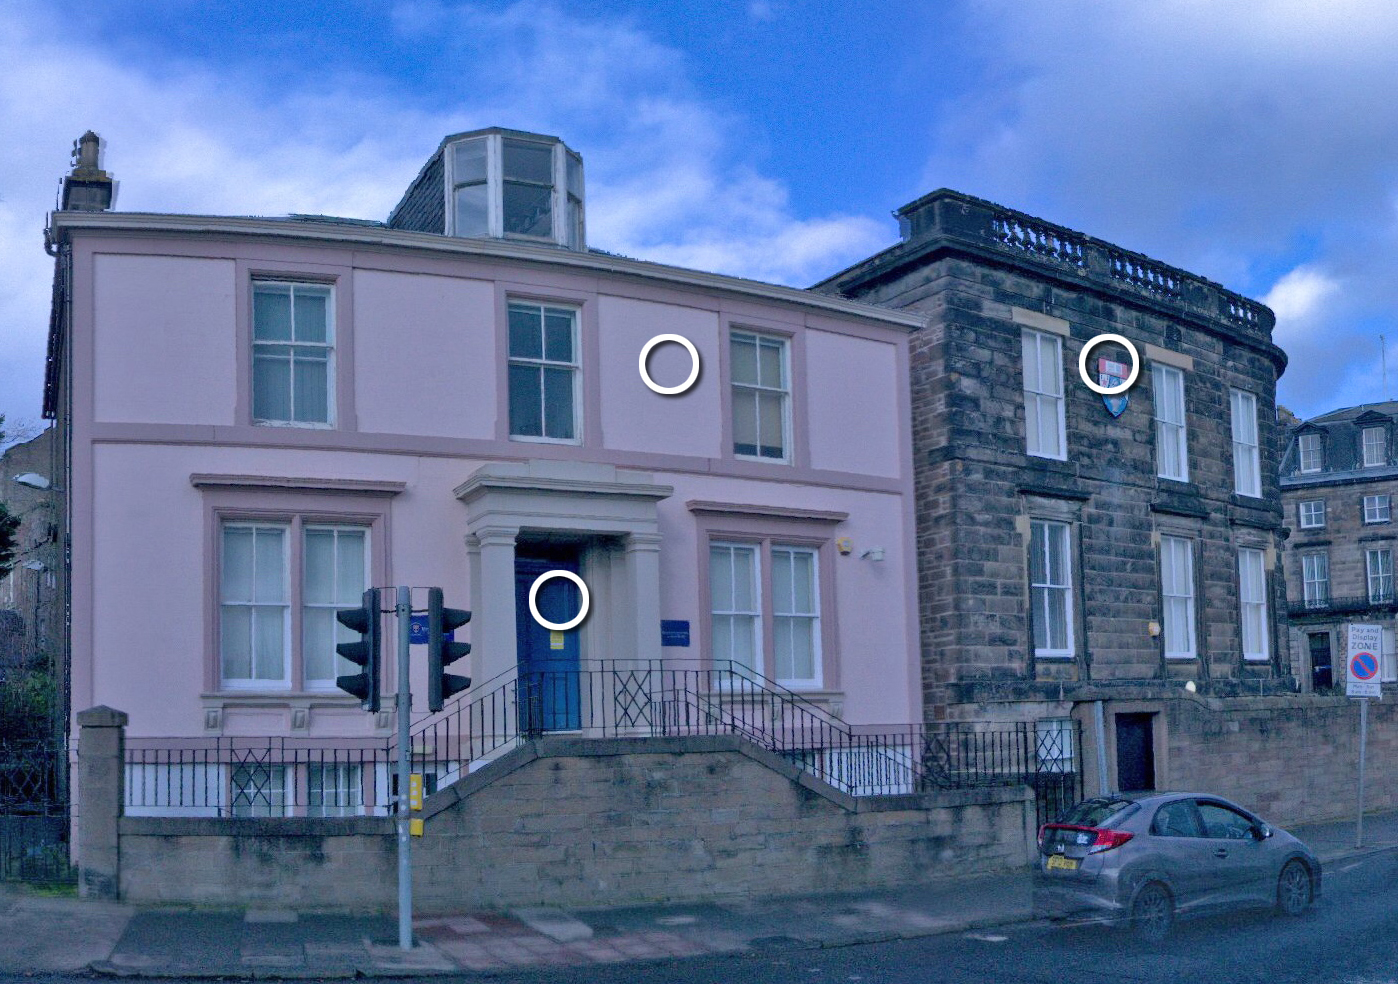
The blue door, the pink wall and the red in the university crest … their colour in the point cloud comes from the 360 image – the laser determines shape and direction of surfaces and the software adds the RGB (red green blue) data to the point based on which pixel of the 360 photograph that beam went out ‘through’.
I told you this machine was clever!
Read on.
